
#GIS #WebGIS #leaflet #JSON #GeoJSON #Javascript #API
[WebGIS教學系列]Leaflet新手教學:打造台中市停車位蜘蛛地圖(Spider Map)
文章目錄
最近正在練習利用Leaflet編寫WebGIS地圖,藉由這個系列分享以及紀錄學習的過程。先前有筆者有發布過兩篇利用QGIS2Web套件,快速轉換QGIS成果為WebGIS的教學文章,有需要的也可以點擊下方連接觀看,雖然QGIS2Web可以滿足簡易的轉換需求,但客製化功能實現還是得進一步的學習Leaflet。
1.什麼是Leaflet和蜘蛛地圖
Leaflet:
是一個開源的JavaScript函式庫,可以讓使用者在網頁上輕鬆地製作互動式的地圖。Leaflet的優點是它非常輕量、易用、支援各種地圖資料來源,並且有豐富的社區資源以及外掛套件可以擴充功能。
蜘蛛地圖(Spider Map):
是一種用於顯示空間數據的特殊圖表,由一個中心點和從中心點發出的多條線條組成,每條線條代表一個位置,線條的長度和顏色可以根據數據的值而變化。蜘蛛地圖的優點是可以清楚地展示空間分佈和相對關係,例如。
在這篇文章中,我將帶你一步一步地學習如何使用Leaflet,並且打造一個台中市停車位蜘蛛地圖,讓你可以快速地找到附近的停車場或路邊停車位。Spider Map應用範例
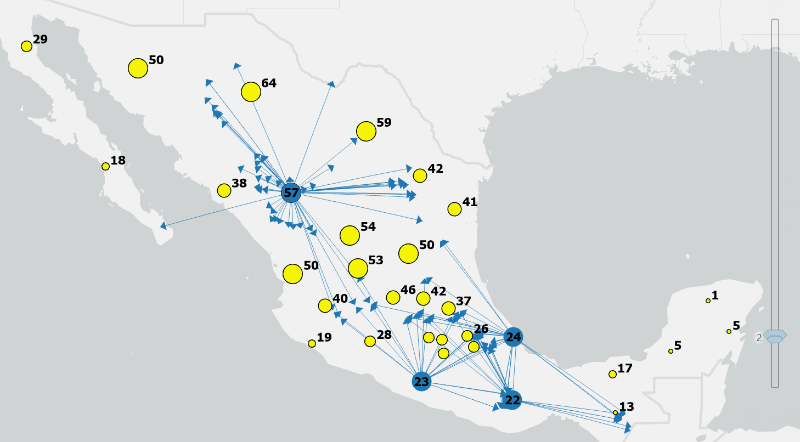
在QGIS或是ArcGIS當中也有相關的空間分析工具可以創造蜘蛛地圖,例如QGIS的RT QSpider以及ArcGIS的Create_Spider_Diagram
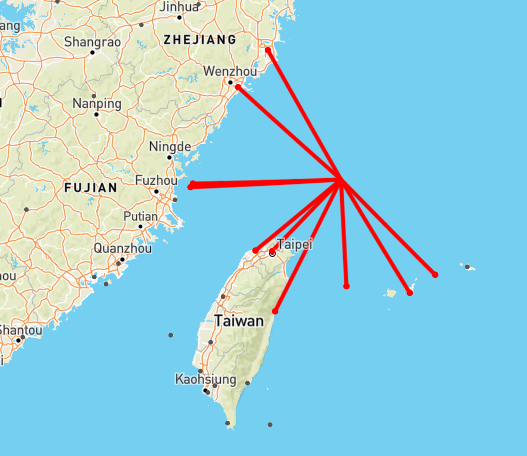
資料來源: 上圖利用ArcGIS Pro的內建工具,分別將起點以及目的地資料作為輸入,進行蜘蛛地圖創建 資料來源:上圖則是飛機迫降地圖,利用Spider Map連接出最近的8個機場,提供飛機迫降資訊,有興趣操作看看從資料連接可以進到該WebGIS網站
2.利用Leaftlet打造台中市停車位蜘蛛地圖
這邊開始步驟教學,筆者是如何利用Leaflet搭配公開資料進行台中市停車位蜘蛛地圖的創建(詳細教學整理好後會再更新07/27),相關原始程式碼可以參考Github
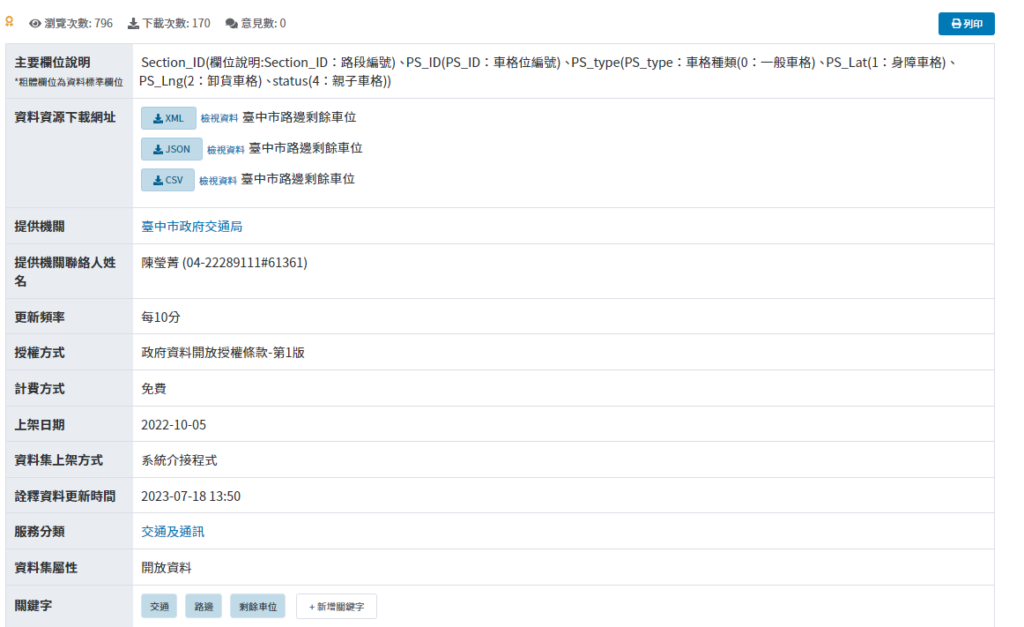
台中市公開資料集-臺中市路邊剩餘車位
這邊利用台中市公開資料集進行JSON資料串接,資料更新頻率為每10分鐘。 2.1 引入Leaftlet-JS庫,並建立基本地圖
以下的程式碼部分可以對照GitHub的檔案組成,首先我們先建立Index.html作為我們WebGIS的主網頁,這邊先介紹如何簡單導入Leaftlet地圖並呈現在網頁上,建議有基本的HTML概念會比較好理解,更詳細的步驟可以參考Leaflet的官方教學
##我們可以藉由網路針對Leaflet進行外部引入,相關程式碼如下,藉由<link>標籤引入leaflet的CSS設定,<Script>則可以引入Leaftlet作為外部庫
<link rel="stylesheet" href="https://unpkg.com/leaflet@1.9.4/dist/leaflet.css" integrity="sha256-p4NxAoJBhIIN+hmNHrzRCf9tD/miZyoHS5obTRR9BMY=" crossorigin="" />
<script src="https://unpkg.com/leaflet@1.9.4/dist/leaflet.js" integrity="sha256-20nQCchB9co0qIjJZRGuk2/Z9VM+kNiyxNV1lvTlZBo=" crossorigin=""></script>

##下列則是額外引入的設定資料,其中包含Leaftlet的cluster擴增庫、尋找最近點的leaflet-KNN庫,以及我自定義的部分設定
<link rel="stylesheet" href="https://unpkg.com/leaflet.markercluster@1.5.1/dist/MarkerCluster.Default.css" />
<script src="https://unpkg.com/leaflet.markercluster@1.5.1/dist/leaflet.markercluster.js"></script>
<script src="leaflet-knn-master\leaflet-knn-master\leaflet-knn.js"></script>
<script src="PS_type.js"></script>
<script src="PS_icon.js"></script>
接下來我們在<body>的部分,新增一個<div>並指定他的id=’map’以及給予適當的長寬設定即可,主要的地圖設定都會在<div id=’map’>進行設定。
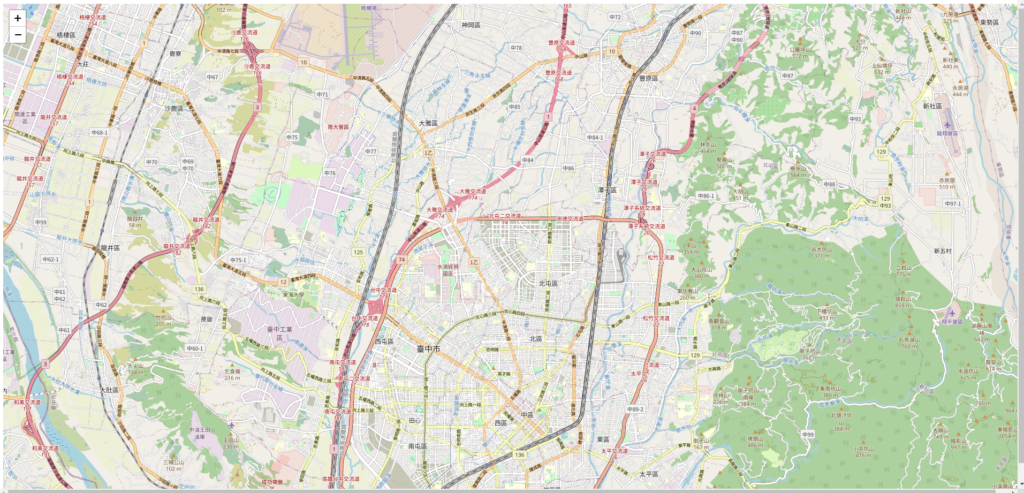
接著我們在<div id=’map’>中藉由<script>標籤編寫Leaflet基本設定。<script> #初始化map物件,.setview:設定地圖中心點,L.titleLayer則是引入OSM作為基本地圖,如果有其他地圖來源可以在此做更改。 var map = L.map('map').setView([24.191075340950587,120.67623138427736], 13); L.tileLayer('https://tile.openstreetmap.org/{z}/{x}/{y}.png', { maxZoom: 17, attribution: '© OpenStreetMap' }).addTo(map); </script>將上述程式碼結合後的成果如下,接下來我們可以直接打開index.html,確認地圖是否正確載入。
<!DOCTYPE html>
<html>
<head>
<title>Spider Map</title>
<link rel="stylesheet" href="https://unpkg.com/leaflet@1.9.4/dist/leaflet.css" integrity="sha256-p4NxAoJBhIIN+hmNHrzRCf9tD/miZyoHS5obTRR9BMY=" crossorigin="" />
<script src="https://unpkg.com/leaflet@1.9.4/dist/leaflet.js" integrity="sha256-20nQCchB9co0qIjJZRGuk2/Z9VM+kNiyxNV1lvTlZBo=" crossorigin=""></script>
</head>
<body>
<div id="map" style="height: 100vh; width: 100vw">
    <script>
    var map = L.map('map').setView([24.191075340950587,120.67623138427736], 13);
    L.tileLayer('https://tile.openstreetmap.org/{z}/{x}/{y}.png', {
        maxZoom: 17,
        attribution: '© OpenStreetMap'
    }).addTo(map);
    </script>
</div>
</body>
</html>
正確載入的話會顯示如上的OSM街道圖 2.2 串接台中市的剩餘車位公開資料並顯示在地圖上
接下來我們要串接停車位資料並顯示在地圖上,這時候要利用的JS中的fetch功能針對資料進行請求並轉換成我們需要的格式。這部分的程式碼較為複雜,建議有JS相關基礎會比較容易了解,
//首先先建立一個collection物件(GeoJSON格式)用來儲存後續整理好停車位資料 var collection = { "type": "FeatureCollection", "features": [] };接下來我們利用fetch函式針對公開資料集進行串接,資料欄位可以參考上圖(公開資料集),其中關於fetch的基本介紹可以參考這裡,其基本概念就是針對網址發出GET、POST請求,接著採用.then()、.catch()函式編寫接受資料成功或失敗要執行的指令。
###這邊利用fetch傳入公開資料提供的停車位資料網址(JSON格式),成功請求資料後以JSON進行解析,這邊為了方便說明會將各個.then()分開來,實際編寫請參考最終成果。
let result=fetch('https://datacenter.taichung.gov.tw/swagger/OpenData/791a8a4b-ade6-48cf-b3ed-6c594e58a1f1')
      .then(response => response.json())
###以JSON檔案解析回傳資料後,我們要針對資料進行格式處理,將JSON格式改成GeoJSON並儲存到collection物件當中
.then((data)=>{ //這邊的data是前步驟中的response.json()回傳進來的
        data.map((item)=>{ //利用map函式遍歷所有的停車位資料
        let point =new L.Marker([item.PS_Lat,item.PS_Lng]);//L.Marker是Leaflet中建立單點marker的物件,輸入參數為點位座標,這邊做為過渡格式
        point.feature={ //針對每個點的屬性資料進行設定,這邊只擷取"車格編號"、"車位種類"以及'是否有車'等三個欄位
          type:'Feature', //其中PStype可以參考下列的設定,我這邊採用外部檔案進行引入,也可以提前在前面進行變數宣告
          properties:{"車格編號":item['PS_ID'],"車位種類":PStype[item['status']],'是否有車':Boolean(Number(item['status']))},
          geometry: undefined
        }//設定好停車位的空間資料及屬性資料後可以進行GeoJSON的轉換並加入至collection當中
        collection.features.push(point.toGeoJSON())})
        //共7000多個停車位,沒做資料優化進行導入的話會造成網頁渲染過慢,可以採用以下.slice函式進行資料切割做為測試
        // collection.features=collection.features.slice(0,1000)
      })
###接下來我們針對GeoJSON進行資料篩選,基本上我們會較關注尚有空位的停車格,因此可以只顯示空位即可,同時縮減資料集加快網頁
      .then(()=>{
        pointJSON=L.geoJSON(collection,{
          filter:(feature)=>feature.properties['是否有車']===false,//藉由每個圖徵['是否有車']欄位進行篩選
          onEachFeature:(feature,layer)=>{ //這邊針對每個圖徵透過Popup添加屬性資料的顯示
            layer.bindPopup('車格種類:'+feature.properties['車位種類']+'<br>車格編號: '+
            feature.properties['車格編號']+'<br>'+'是否有車: '+feature.properties['是否有車']);
            if (feature.properties['是否有車']){
              layer.setIcon(icons[1]['icon']) //這邊透過['是否有車']欄位選擇要採用的icon設定,相關設定可以參考PS_icons.js,但這邊實際上只會顯示有空位的綠燈圖而已
            }else{
              layer.setIcon(icons[0]['icon'])
            }
          }
        })
       //透過L.markerClusterGroup()將marker進行集群可以大幅加速網頁的速度,最後藉由addTo()將圖層加入至地圖當中
        let markersCluster = L.markerClusterGroup().addLayer(pointJSON).addTo(map);//
      })
PStype={ '0':'一般車格', '1':'身障車格', '2':'卸貨車格', '4':'親子車格', }完整的程式碼組成如下:
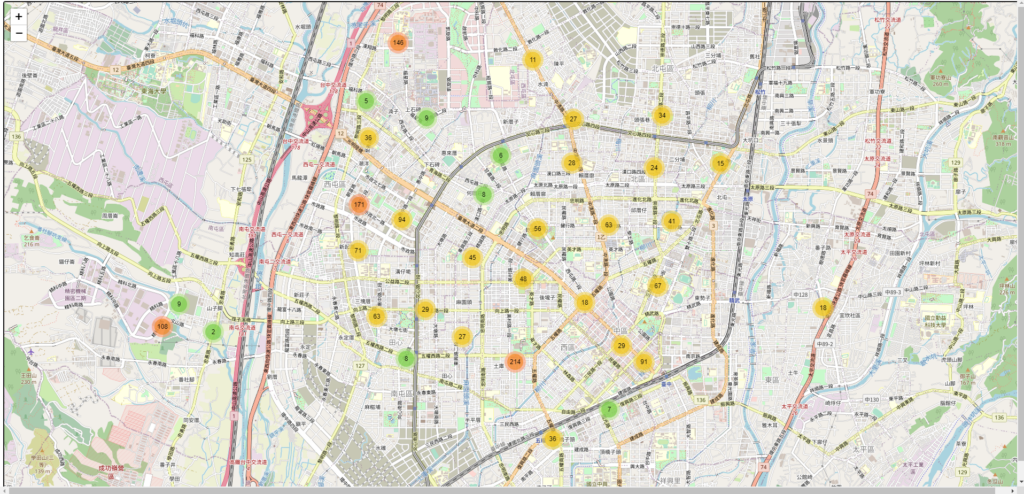
<!DOCTYPE html>
<html>
<head>
<title>Spider Map</title>
<link rel="stylesheet" href="https://unpkg.com/leaflet@1.9.4/dist/leaflet.css" integrity="sha256-p4NxAoJBhIIN+hmNHrzRCf9tD/miZyoHS5obTRR9BMY=" crossorigin="" />
<script src="https://unpkg.com/leaflet@1.9.4/dist/leaflet.js" integrity="sha256-20nQCchB9co0qIjJZRGuk2/Z9VM+kNiyxNV1lvTlZBo=" crossorigin=""></script>
<link rel="stylesheet" href="https://unpkg.com/leaflet.markercluster@1.5.1/dist/MarkerCluster.Default.css" />
<script src="https://unpkg.com/leaflet.markercluster@1.5.1/dist/leaflet.markercluster.js"></script>
<script src="leaflet-knn-master\leaflet-knn-master\leaflet-knn.js"></script>
<script src="PS_type.js"></script>
<script src="PS_icon.js"></script>
</head>
<body>
<div id="map" style="height: 100vh; width: 100vw">
  <script>
    console.log(icons)
    // Create a map
    var map = L.map('map').setView([24.191075340950587,120.67623138427736], 13);
    L.tileLayer('https://tile.openstreetmap.org/{z}/{x}/{y}.png', {
        maxZoom: 17,
        attribution: '© OpenStreetMap'
    }).addTo(map);
    // 添加地圖標記
    var collection = {
    "type": "FeatureCollection",
    "features": []
    };

    let pointJSON
    let result=fetch('https://datacenter.taichung.gov.tw/swagger/OpenData/791a8a4b-ade6-48cf-b3ed-6c594e58a1f1')
      .then(response => response.json())
      .then((data)=>{
        data.map((item)=>{
        let point =new L.Marker([item.PS_Lat,item.PS_Lng]);
        point.feature={
          type:'Feature',
          properties:{"車格編號":item['PS_ID'],"車位種類":PStype[item['status']],'是否有車':Boolean(Number(item['status']))},
          geometry: undefined
        }
        collection.features.push(point.toGeoJSON())})
        // collection.features=collection.features.slice(0,1000)
      })
      .then(()=>{
        pointJSON=L.geoJSON(collection,{
          filter:(feature)=>feature.properties['是否有車']===false,
          onEachFeature:(feature,layer)=>{
            layer.bindPopup('車格種類:'+feature.properties['車位種類']+'<br>車格編號: '+
            feature.properties['車格編號']+'<br>'+'是否有車: '+feature.properties['是否有車']);
            if (feature.properties['是否有車']){
              layer.setIcon(icons[1]['icon'])
            }else{
              layer.setIcon(icons[0]['icon'])
            }
          }
        })
        let markersCluster = L.markerClusterGroup().addLayer(pointJSON).addTo(map);//
      })
    </script>
</div>
</body>
</html>
儲存後重新刷新index.html應該可以發現停車位資料被載入道地圖當中了
2.3.找尋最近的八個停車位並創建蜘蛛圖
接下來我們來拆解一下蜘蛛圖的核心概念,1.尋找最近的N個目標 2.進行線段的連接,接下來根據上述兩個概念進行功能實現。
//getClosestNMarker採用leaflet-KNN提供的功能函式leafletKnn,用來提供我們距離目標點最近的8個點(畢竟是蜘蛛),被尋找的圖層、要找尋的點數、目標點
function getClosestNMarker(markers,pointNum,e) {
      let cloestPoint=leafletKnn(markers).nearest(e,pointNum)
      return cloestPoint;
    }
    let multipolyline=L.polyline([])//用來儲存最N點與目標點的線段
    map.on('move', function(e){
      multipolyline.remove() //先進行清空,不然線段會逐次累積
      let latlang_N=[] //用來儲存最近N點的座標
      // 取得點擊事件的位置
      // var lat = e.latlng.lat;
      // var lng = e.latlng.lng;
      let latlng = map.getCenter(); ##將視圖中心坐標當作目標點
      // 尋找最近的8個空車位
      var closestMarker = getClosestNMarker(pointJSON,8,latlng);
      if (closestMarker) {
        // for loop在每兩點間創造一個線段
        for(let i=0;i<closestMarker.length;i++){
        latlang_N.push([closestMarker[i].layer.getLatLng(),latlng])};
      }
      multipolyline = L.polyline(latlang_N).addTo(map)
    }
      )
完整程式碼如下:
<!DOCTYPE html>
<html>
<head>
<title>Spider Map</title>
<link rel="stylesheet" href="https://unpkg.com/leaflet@1.9.4/dist/leaflet.css" integrity="sha256-p4NxAoJBhIIN+hmNHrzRCf9tD/miZyoHS5obTRR9BMY=" crossorigin="" />
<script src="https://unpkg.com/leaflet@1.9.4/dist/leaflet.js" integrity="sha256-20nQCchB9co0qIjJZRGuk2/Z9VM+kNiyxNV1lvTlZBo=" crossorigin=""></script>
<link rel="stylesheet" href="https://unpkg.com/leaflet.markercluster@1.5.1/dist/MarkerCluster.Default.css" />
<script src="https://unpkg.com/leaflet.markercluster@1.5.1/dist/leaflet.markercluster.js"></script>
<script src="leaflet-knn-master\leaflet-knn-master\leaflet-knn.js"></script>
<script src="PS_type.js"></script>
<script src="PS_icon.js"></script>

</head>
<body>
<div id="map" style="height: 100vh; width: 100vw">
  <script>
    console.log(icons)
    // Create a map
    var map = L.map('map').setView([24.191075340950587,120.67623138427736], 13);
    L.tileLayer('https://tile.openstreetmap.org/{z}/{x}/{y}.png', {
        maxZoom: 17,
        attribution: '© OpenStreetMap'
    }).addTo(map);
    // 添加地圖標記
    var collection = {
    "type": "FeatureCollection",
    "features": []
    };

    let pointJSON
    let result=fetch('https://datacenter.taichung.gov.tw/swagger/OpenData/791a8a4b-ade6-48cf-b3ed-6c594e58a1f1')
      .then(response => response.json())
      .then((data)=>{
        data.map((item)=>{
        let point =new L.Marker([item.PS_Lat,item.PS_Lng]);
        point.feature={
          type:'Feature',
          properties:{"車格編號":item['PS_ID'],"車位種類":PStype[item['status']],'是否有車':Boolean(Number(item['status']))},
          geometry: undefined
        }
        collection.features.push(point.toGeoJSON())})
        // collection.features=collection.features.slice(0,1000)
      })
      .then(()=>{
        pointJSON=L.geoJSON(collection,{
          filter:(feature)=>feature.properties['是否有車']===false,
          onEachFeature:(feature,layer)=>{
            layer.bindPopup('車格種類:'+feature.properties['車位種類']+'<br>車格編號: '+
            feature.properties['車格編號']+'<br>'+'是否有車: '+feature.properties['是否有車']);
            if (feature.properties['是否有車']){
              layer.setIcon(icons[1]['icon'])
            }else{
              layer.setIcon(icons[0]['icon'])
            }
          }
        })
        let markersCluster = L.markerClusterGroup().addLayer(pointJSON).addTo(map);//
      })

    function getClosestNMarker(markers,pointNum,latlng) {
      let cloestPoint=leafletKnn(markers).nearest(latlng,pointNum)
      return cloestPoint;
    }
    let multipolyline=L.polyline([])
    map.on('move', function(e){
      multipolyline.remove()
      let latlang_N=[]
      // 取得點擊事件的位置
      // var lat = e.latlng.lat;
      // var lng = e.latlng.lng;
      let latlng = map.getCenter();
      // 尋找最近的8個空車位
      var closestMarker = getClosestNMarker(pointJSON,8,latlng);
      // 尋找最近的8個空車位
      if (closestMarker) {
        // 在兩點間創造一個線段
        for(let i=0;i<closestMarker.length;i++){
        latlang_N.push([closestMarker[i].layer.getLatLng(),latlng])};
      }
      multipolyline = L.polyline(latlang_N).addTo(map)
    }
      )
    </script>
</div>
</body>
</html>
接下來重整Index.html就可以展示跟下圖一樣的蜘蛛地圖效果了。
3.地圖成果展現
地圖成果連接:https://spatialgeolab.github.io/SpiderMap_TaichungPS/
結語
今天的分享就到這裡了,這篇文章可能我有時間的話會錄影片教學,喜歡我的分享的話可以訂閱我的YT頻道以及FB專頁會分享更多有趣的地圖應用